Prediction of meat quality of different pig breed combination in Estonia
A.Tänavots, E.Somelar, O.Saveli, K.Eilart, A.Põldvere, T.Kaart, H.Viinalass, S.Värv. Estonian Agricultural University, Kreutzwaldi 1, Tartu 51014, Estonia
Abstract
The aim of this study was to estimate meat quality of live pigs and carcasses in pig breed combinations. 193 pigs were tested ultrasonically 1998...1999 in Kehtna Swine Testing Station. Five groups of pigs were under observation - purebred Estonian Landrace (EL), Estonian Large White (ELW), Finnish Yorkshire (FY) and crossbred Hampshire (H)♂xELW♀; H/EL/ELW♂xEL♀. Ultrasonic measurements were made with Piglog-105 and A-Scan Plus. Pigs were tested at the weight of 93...112 kg. Traits recorded: sidefat thickness at last (x1) and 11...12th (x3) rib, and diameter of loin eye (x2). Lean meat percentage (y) was calculated. Blood samples from pigs were collected for identification of HAL genotypes by using DNA test. Carcasses were evaluated with an Ultra-FOM 100 in Valga Meat and Canning Factory. Carcass length, weight, sidefat thickness by ruler (in 4 points) and pH (24 h), were collected. Loin eye area was measured by planimeter; sidefat and diameter of loin eye by ruler. 48 hours after slaughtering, pH and boiling loss were found. The GLM procedure was used for analysing the dataset. Significantly lower sidefat thickness and higher lean meat% was measured in H/EL/ELW♂xEL♀ with ultrasonic equipments and ruler. Higher sidefat thickness and lower lean meat%was found in ELW and FY breed. EL had significantly longer carcasses, than FY and crossbred pigs. Best influence to meat quality gave EL and H breed.
Introduction
During the last decade the Estonian meat market has changed considerably. Consumers have started to require quality meat and meat products based on environmental, ethic and welfare concerns. Whether the acceptable pig carcass is fat or lean depends more on national predilection. As industrialisation develops, the desire for lean meat appears to dominate the definition of carcass quality (Whittemore, 1996). Different methods to estimate meat content and pork quality have been used during the times (Kempster and Evans, 1979).
The aim of this study was to estimate meat quality of live pigs and their carcasses, and to investigate the effect of breed combination on the meat quality.
Material and Methods
Hundred ninety-three pigs were tested ultrasonically between 1998...1999 in Kehtna Swine Testing Station. Animals originated from 22 different farms over Estonia. All pigs were kept according to the rules of control fattening, where two pigs were kept in the pen during testing time (at 25 to 100 kg) in stable feeding conditions. Five groups of purebred and crossbred pigs were under observation - purebred Estonian Landrace (EL), Estonian Large White (ELW), Finnish Yorkshire (FY) and crossbred Hampshire ♂ x ELW ♀ (H/ELW), H/EL/ELW ♂ x EL ♀ (H/EL/ELW x EL).
Live Animal Measurements. Ultrasonic measurements, backfat thickness and diameter of loin eye, were made with Piglog 105 and A-Scan Plus. Pigs were tested one day before slaughter. The following traits were recorded: backfat thickness at last (x1) and 11...12th (x3) rib, 7 cm from midline (mm), and diameter of loin eye (x2), 7 cm from midline (mm). Lean meat percentage (y) was calculated using the formula:
y = 64.39 - 0.28x1 + 0.14x2 - 0.55x3
During ultrasonic testing weight, date and origin farm were registered, where testing weight was 93...112 kg. Testing year was divided into four parts: spring - March, April, May; summer - June, July, August; fall - September, October, November; and winter - December, January, February.
Carcass Measurements. All pigs were slaughtered on next day after ultrasonic testing in Valga Meat and Canning Factory. Ultrasonic measurements were made on slaughter day, where carcasses were evaluated with an Ultra-FOM 100 in the same points as described above. Carcass data as carcass length, weight, backfat thickness by ruler (at scruff, at 6...7th rib, at middle and at lumbar) and pH (24 and 48 hours after slaughtering), were collected after slaughter. To measure pH and draw loin eye, half of the carcass was cut at last rib. Loin eye area was measured by planimeter, from same drawings, backfat and diameter of loin eye was measured. 48 hours after slaughtering, pH and boiling loss were found.
The General Linear Model (GLM) procedure (SAS Inst. Inc., 1991) was used for analysing the dataset by analyses of variance. The following statistical model was used:
Yijkl=μ+Wtijkl+Fi+Tj+Sk+eijkl,
|
Y |
= |
dependent
variable; |
Tj |
= |
effect
of breed 1...5; |
The results are given as least-square means (Parring et al., 1997). Level of significances expressed conventionally: a, b, c – least square, within each effect with one letter in common do not differ significantly.
Genetic Analyse. A total of 101 pigs were sampled for identification of HAL genotype. Genomic DNA was extracted from blood. The HAL genotypes were determined according to the method of Fujii et al. (1991). The DNA fragments were separated on a 3% agarose (NuSieve 3:1) gele and stained with ethidium bromide.
On the basis of DNA test the pigs were assigned into two groups HAL normal homozygous (NN, n=85) and HAL hetrozygous (Nn, n=16). The HAL homozygous mutant (nn) animals among investigated pigs were not found.
Table 1. Descriptive statistics of genetic analyse
|
|
Breed |
Total |
||||
|
|
EL |
ELW |
FY |
H x ELW |
H/EL/ELW x EL |
|
|
No. of animals |
73 |
20 |
2 |
3 |
3 |
101 |
|
Frequency of HAL gene |
0.151 |
0.25 |
0 |
0 |
0 |
0.158 |
As trait, HAL gene, have only two possible values here - 1 and 0 (HAL gene carrier or not), there is binomial distribution and suitable models to use is logistic regression and generalized linear models with appropriate link-funktions. More used link-funktion for binomial models is logit-transformation:
![]() ,
, ![]() –
probability
of carrying HAL gene.
–
probability
of carrying HAL gene.
Following model was used to analyse dataset:
![]() ,
,
where
![]() - intercept, Ti - breed
effect, Xij weight and b - regression coefficient .
- intercept, Ti - breed
effect, Xij weight and b - regression coefficient .
Results and Discussion
Measuring backfat by ultrasonic equipments and ruler, significantly thinner backfat (9.38...14.71) and higher lean meat percentage (61.17...61.95 %) were found in three breed cross (H/EL/ELW x EL), compared with other breed combinations (Table 2). Most scientists have found, that meat traits are hardly influenced by crossbreeding, as they are average or highly heritable (Skarman, 1965; Andersson, 1980). Meat traits are heredity as intermediate in crossbreeding. As Hampshire is well known in world by its thin fat and high lean meat percentage (Whittemore, 1996; Tänavots and Kaart, 1999), it has a significant influence on crossbred pig meat quality. Thicker backfat of ELW caused thicker backfat in H x ELW cross, compared with H/EL/ELW x EL cross.
Table 2. Least-square means of meat traits measured by ultrasonic equipments in different pig breed crossing combinations
|
Trait |
EL |
ELW |
FY |
H x ELW |
H/EL/ELW x EL |
|
n=137 |
38 |
7 |
7 |
4 |
|
|
A-Scan x1 (mm) |
16.14b |
20.76c |
19.85bc |
18.10bc |
11.15a |
|
x2 (mm) |
54.21a |
55.03a |
58.86a |
56.65a |
53.84a |
|
x3 (mm) |
14.43b |
19.25c |
18.69bc |
16.19bc |
9.38a |
|
y (%) |
59.52b |
55.69c |
56.79bc |
58.35bc |
63.65a |
|
Piglog 105 x1 (mm) |
18.52bc |
21.75c |
21.07bc |
18.00b |
11.02a |
|
x2 (mm) |
47.72a |
46.57a |
46.11a |
47.11a |
46.52a |
|
x3 (mm) |
17.60bc |
18.85c |
19.63bc |
13.81ab |
10.36a |
|
y (%) |
56.06bc |
54.27c |
53.91bc |
57.85ab |
61.95a |
|
Ultra FOM x1 (mm) |
17.32ac |
24.02b |
23.09bc |
23.54bc |
14.71a |
|
x2 (mm) |
50.50a |
50.74a |
50.69a |
45.10a |
54.26a |
|
x3 (mm) |
17.41a |
25.79bc |
22.03ac |
25.30bc |
13.94a |
|
y (%) |
57.32b |
50.88c |
53.29bc |
52.17bc |
61.17a |
|
By ruler backfat (x1) (mm) |
13.78ab |
18.67b |
21.09b |
13.88ab |
8.59a |
|
diameter of LD (mm) |
58.25ab |
52.96b |
54.47ab |
57.26ab |
62.36a |
|
area of LD (cm2) |
37.99a |
33.42b |
36.01ab |
39.96a |
41.97a |
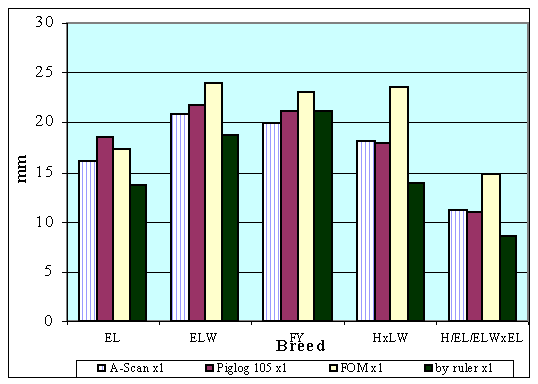
Very thick fat was measured only with Ultra-FOM 100 in H x ELW cross (Figure 1). Quite surprising was thick fat of purebred FY pigs, which was not, however, significantly different compared with other purebred pigs. Backfat of EL pigs differed significantly on ELW measured by A-Scan Plus and Ultra-FOM 100.
Diameter of loin eye did not differ significantly between breeds, measured by ultrasonic equipments. A significant difference, however, was found between ELW and H/EL/ELW x EL, where the diameter of loin eye (LD) of the cross was by 9.4 mm larger. As diameter of loin eye was quite equal, lean meat percentage was influenced more by differences between backfat. To compare between two points of ultrasound measurement, equal fat was found by A-Scan (difference 1.16...1.91). In case of using Piglog 105 the backfat thickness varied between 0.66...4.19 mm in different places of measurement. Inversely to other equipments, thinner fat in x1, than x2 was found by using Ultra-FOM 100, except for three breed crosses.
Carcass weight did not differ between the breeds, being 70.21...72.40 kg and was lower in H/EL/ELW x EL cross and higher in FY breed (Table 3). Significantly longer carcass was in purebred pigs in EL (99.15 cm) and shorter in FY (93.43 cm). Crossbred pig carcasses were also significantly shorter than in EL.
Table 3. Least-square means of meat traits in different pig breed combinations after slaughter
|
Trait |
EL |
ELW |
FY |
H x ELW |
H/EL/ELW x EL |
|
Carcass weight (kg) |
71.45a |
71.79a |
72.40a |
71.58a |
70.21a |
|
lenght (cm) |
99.15b |
97.07ab |
93.43a |
95.07a |
94.24a |
|
Backfat at (by ruler) scruff (mm) |
35.39a |
44.12b |
39.93ab |
36.10a |
30.89a |
|
6...7th rib (mm) |
23.29a |
25.15a |
22.29a |
20.51a |
18.23a |
|
middle (mm) |
19.01a |
21.54a |
19.60a |
18.40a |
15.32a |
|
lumbar (mm) |
32.33a |
31.34a |
27.71a |
29.79a |
27.48a |
|
Average |
27.70b |
30.91b |
28.35ab |
27.31ab |
22.78a |
|
pH 24 |
5.56a |
5.57a |
5.51a |
5.57a |
5.41a |
|
pH 48 |
5.51a |
5.54a |
5.35a |
5.60a |
5.49a |
|
pH difference |
0.05 |
0.03 |
0.16 |
-0.03 |
-0.08 |
|
Boiling loss (%) |
44.46a |
43.04a |
43.19a |
45.12a |
45.29a |
Higher fat for carcasses were measured in scruff and thinner in middle (Figure 2). As in Ultrasonic test, thicker fat was found in ELW pig carcasses by ruler. They had significantly higher fat compared with EL and crossbred pig carcasses. Backfat was quite equal measured at 6...7 rib, middle and lumbar.
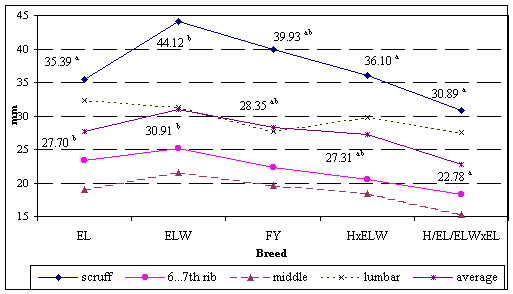
Figure 2. Carcass backfat depth measured by ruler
No significant differences were found between breed combinations for meat pH and boiling loss. But it should be noted, that 24 hours after slaughtering meat pH from crossbred pigs was lower than in 48 hours, while in purebred pigs this trait was higher. Meat from crossbred pigs had slightly higher boiling loss.
Genetic Analyse. Main reason, why there wasn't no influence between breed and HAL gene was different number of animals in breeds (Table 1). There was significant influence between testing weight and HAL gene (p<0.05), when breed effect was skipped (Table 4).
Table 4. Difference between testing weight according to HAL gene (0 - not carrier, 1 -carrier)
|
|
HAL gene |
Total |
|
|
|
0 |
1 |
|
|
No. of animals |
85 |
16 |
101 |
|
Average testing weight |
100.87 |
99.06 |
100.58 |
To predict probability of carrying HAL gene according to testing weight, was found, that possibility to carry HAL gene is lower in heavier pigs at the same age (Figure 3).
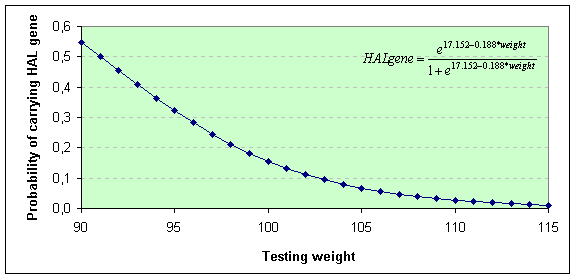
Figure 3. Probability of carrying HAL gene according to testing weight (at same age)
As market demands more and more quality lean meat and in pig selection for breeding consider more about meat quality traits, the different possibilities to measure live pig meat quality and enhance measuring accuracy must be investigated. Moreover, the ability of local and imported breeds to produce quality meat by crossing must be estimated. According to trial results, crossing Estonian sows with Hampshire boar gave thin fat and high lean meat percentage. From local breeds, Estonian Landrace breed gave better results for producing fattening pigs.
References
Andersson, K. 1980. Studies on Crossbreeding and Carcass Evaluation in Pigs. Sveriges Lantbr.uni. R. 46. 126 p.
Fujii J., Otsu K., Zorzato F., De Leon S., Khanna V.K., Weiler J., O’Brien P. J. & MacLennan D.H. 1991. Identification of a Mutation in Porcine Ryanodine Receptor Associated with Malignant Hyperthermia. Science 253, 448...451.
Kempster, A.J., Evans, D.G. 1979. A comparison of different predictors of the lean content of pig carcasses. 1. Predictors for use in commercial classification and grading. Anim. Prod. 28, 87...96.
Parring, A-M., Vähi, M., Käärik, E. 1997. Statistilise andmetöötluse algõpetus. TÜ Mat. stat. inst. TÜ Kirjastus. p. 183...254.
Skarman, S. 1965. Crossbreeding Experiment with Swine. Lantbrukshögskolans Annaler. 31, 3...92.
Tänavots, A., Kaart, T. 1999. Comparison of Different Pig Breed Combinations by Using Data from Piglog 105. 50th Meeting of the EAAP. Zürich, Swizerland. August 22-26. 5 p.
SAS. 1991. SAS User’s guide: Statistics. SAS Inst. Inc., GARY, NC. 305 p.
Whittemore, C. 1996. The Science and Practice of Pig Production. Longman Scientific & Technical. 5...82.
Acknowledgments
Estonian Science Foundation
Valga Meat and Canning Factory
Kehtna Swine Testing Station
Genetic investigation was supported by the Estonian Science Foundation (grant No 3153).